See exactly what your FileMaker scripts are doing.
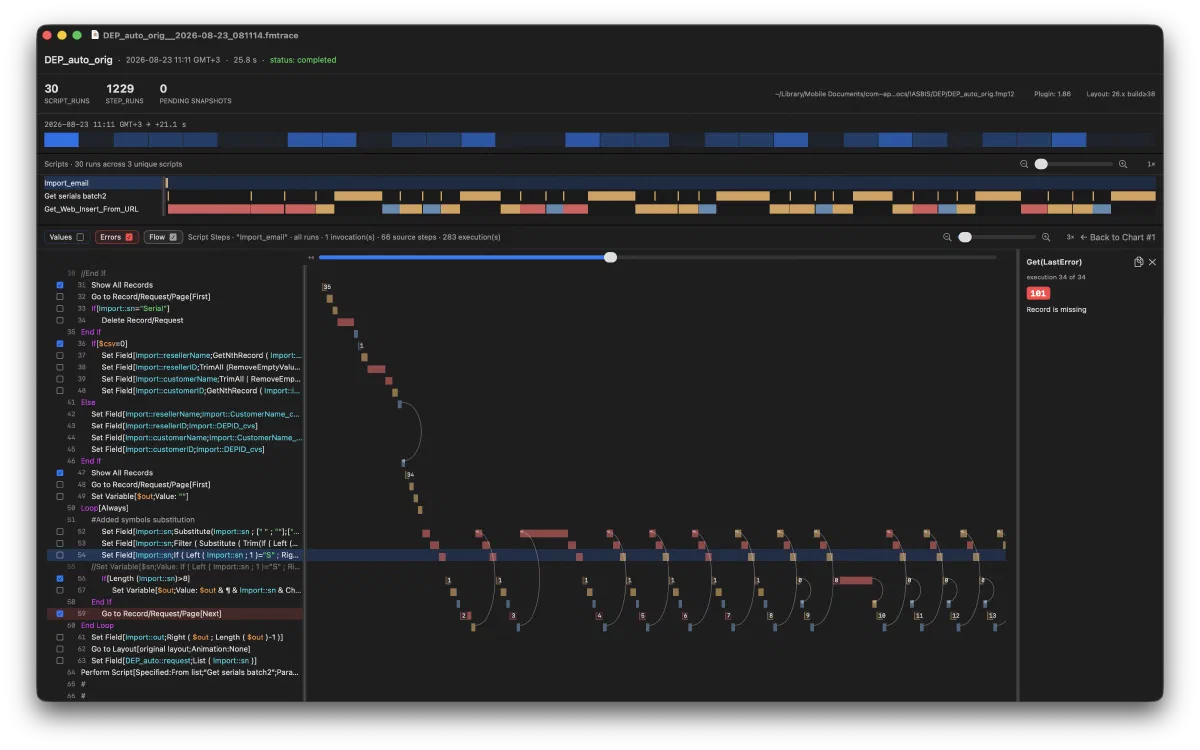
fmTrace records every script and every script step FileMaker Pro executes, then renders the whole run as a timeline you can zoom into — with the timings, the variables, the field values and the errors attached to the steps that produced them.
The problem
Script execution in FileMaker is a black box.
You run one script. It calls other scripts, opens layouts that fire their own triggers, and loops over records — and all you see is the result at the end. The Script Debugger will walk you through one step at a time, but it never shows you the shape of the whole run: which script ate eleven seconds, which step inside it was responsible, or how a variable drifted across two hundred iterations.
fmTrace records the run instead of interrupting it. You work with the database the way you normally would; when you stop, the entire execution opens as a timeline.
What you get
Every script, every step, on one timeline.
The whole run at a glance
Every script invocation laid out on a shared time axis, so nested calls and trigger-fired scripts show their real relationship.
Find the bottleneck
Step-level timing across every execution. The long blocks are the expensive ones — drag to select a region and zoom in on it.
Variables and fields over time
Captured values are attached to the step that produced them, so you can watch $i or a field change across two hundred loop iterations.
Errors in context
Every step whose Get(LastError) was non-zero is marked on the timeline, next to the steps that ran before it.
Flow view
Follow control flow through loops, conditionals and script calls, drawn over the step list rather than described in a log.
Recordings are files
A session is one .fmtrace file. Keep it, compare it against a later run, or send it to whoever needs to look at it.
How it works
Two modules, three steps.
Install the plug-in and the viewer
One
.pkgputsfmTrace.fmpluginwhere FileMaker Pro looks for plug-ins andfmTrace.appin your Applications folder.Turn on Track Scripts
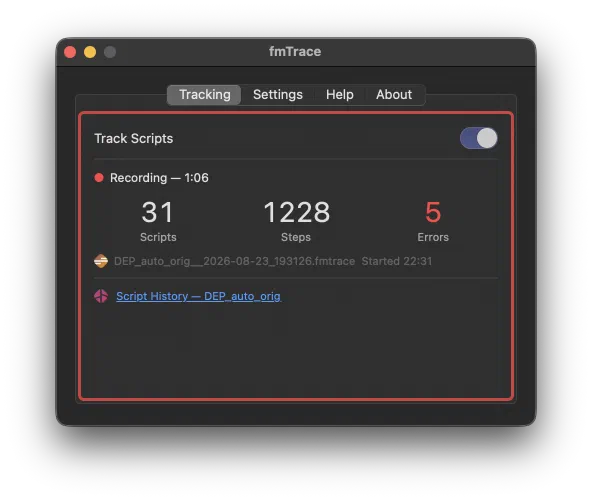
Open Script Workspace, click the fmTrace button, flip the switch — then use the database normally. Live counts show what is being captured.
Stop, and read the timeline
The viewer opens the recording automatically. Zoom into the slow region, pick a script, and read its steps.
Requirements
fmTrace is in beta.
It is stable enough for daily use and it is under active development — expect frequent releases. Keep recordings under roughly 100,000 executed steps; beyond that the viewer gets sluggish. If something breaks, we want to hear about it.
Community
Talk to us.
Mailing list
Release announcements, beta notes and questions from other testers live on
fmtrace@groups.io. Subscribe by sending an empty
message to fmtrace+subscribe@groups.io, or follow the
RSS feed.
Found a bug?
Send the .fmtrace file, your FileMaker version and what you were doing to
support@fmtrace.com. Crash reports are
especially welcome while fmTrace is in beta.